
Brain pharmacology of intrathecal antisense oligonucleotides revealed through multimodal imaging
June 18, 2026
The 2019 JCI Insight by Mazur, C., et al., researches Brain pharmacology of intrathecal antisense oligonucleotides revealed through multimodal imaging.
Introduction
Intrathecal (IT) delivery and pharmacology of antisense oligonucleotides (ASOs) for the CNS have been successfully developed to treat spinal muscular atrophy. However, ASO pharmacokinetic (PK) and pharmacodynamic (PD) properties remain poorly understood in the IT compartment. We applied multimodal imaging techniques to elucidate the IT PK and PD of unlabeled, radioactively labeled, or fluorescently labeled ASOs targeting ubiquitously expressed or neuron-specific RNAs. Following lumbar IT bolus injection in rats, all ASOs spread rostrally along the neuraxins, adhered to meninges, and were partially cleared to peripheral lymph nodes and kidneys. Rapid association with the pia and arterial walls preceded passage of ASOs across the glia limitans, along arterial intramural basement membranes, and along white-matter axonal bundles. Several neuronal and glial cell types accumulated ASOs over time, with evidence of probable glial accumulation preceding neuronal uptake. IT doses of anti-GluR1 and anti-Gabra1 ASOs markedly reduced the mRNA and protein levels of their respective neurotransmitter receptor protein targets by 2 weeks and antiGabra1 ASOs also reduced binding of the GABAA receptor PET ligand 18F-flumazenil in the brain over 4 weeks. Our multimodal imaging approaches elucidate multiple transport routes underlying the CNS distribution, clearance, and efficacy of IT-dosed ASOs.
Finding Highlights
- Apply multimodal imaging techniques to elucidate the IT PK and PD of unlabeled, radioactively labeled, or fluorescently labeled ASOs targeting ubiquitously expressed or neuron-specific RNAs.
- Approaches elucidate multiple transport routes underlying the CNS distribution, clearance, and efficacy of IT-dosed ASOs
Key Results and Figure Interpretation
- SPECT/CT live imaging of IT-dosed ASO (Fig.1).
To determine the kinetics of ASO distribution up the neuraxis following IT delivery, we labeled an ASO targeted to the non–protein-coding RNA Malat1 with 125I and followed it via SPECT/CT live imaging. Here, this IT injection protocol resulted in rapid delivery of 125 I-Malat1-ASO throughout the neuraxial IT space (Figure 1A). Cranial entry of signal was observed immediately after dosing (Figure 1A). Clearance from the IT space into the periphery was observed much later, with accumulation of the radioactive signal observed in head and neck lymph nodes and kidneys by 4 hours after dosing, with the kidney signal peaking 1 day after dosing. This may be a limitation of the imaging technique, as ASO is most likely present in these structures at earlier time points, but at levels too low to be detected with the imaging modality. Although the overall signal declined with time, the relative whole-body distribution pattern of ASOs remained the same between 1 and 7 days after dosing. SPECT/CT images and whole-body autoradiography identified high retention of signal in the meninges covering the spinal cord and nerve roots, at the base of the brain, and in the region of the tentorium cerebelli and superior sagittal sinus (Figure 1, A and B). Radioactive signal appeared in the nasal turbinates immediately after IT dosing and the appearance of this signal preceded the observed accumulation into the submandibular, deep cervical, paraspinal, and abdominal lymph nodes (Figure 1, A and B). The strong meningeal SPECT signal limited the visualization of parenchymal penetration of ASO with live nuclear imaging. Thus, brain penetration of 125 I-ASO was visualized by autoradiography (Figure 1B).
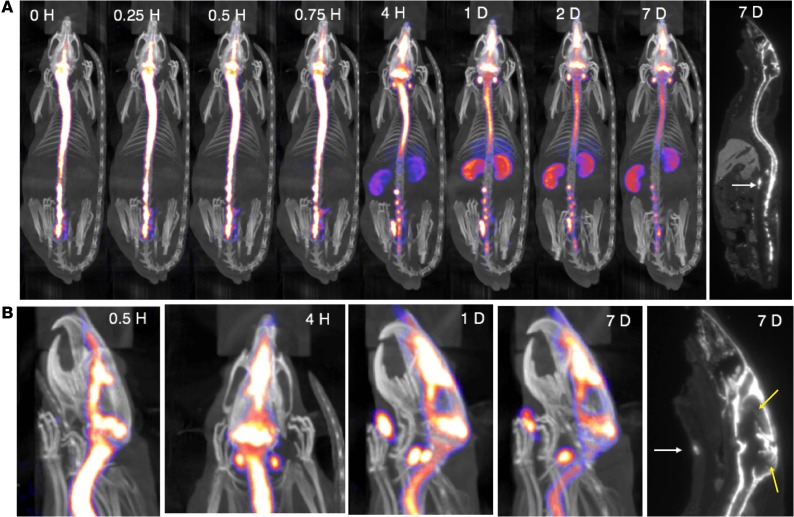
Figure 1. SPECT/CT live imaging of IT-dosed ASO.
- Immunohistochemical tracking of ASO PK and PD in the CNS (Fig.2).
Following IT injection, ASOs were rapidly associated with the meningeal pia mater by 15 minutes after dosing (Figure 2A). Between 1 and 8 hours after IT bolus, diffuse ASO staining permeated the gray and white matter of the spinal cord and the brain. In the spinal cord, lumbar uptake preceded thoracic and cervical uptake. In the brain, a centripetal accumulation pattern was seen, with gray-matter regions closest to the subarachnoid CSF accumulating signal first, beginning as early as 1 hour and progressing to cover most of the gray matter by 8 hours after dose (Figure 2A). ASO accumulated in substructures of the cerebral cortex, hippocampus, and cerebellar cortex by 24 hours, remained until at least 8 weeks, and was cleared to nearly undetectable levels by 16 weeks after dosing.
In single sections, we performed fluorescence IHC for the ASO and GluR1 protein and compared to mRNA quantified from regions collected from adjacent slides. In treatment-naive animals, diffuse brain staining of GluR1 was seen in gray-matter structures with enrichment in hippocampus, cerebellum, and striatum (Figure 2C). Quantitative image analysis revealed that following ASO treatment, GluR1 mRNA and protein expression both declined over time and the expression levels of both were clearly suppressed by 2 weeks after ASO administration (Figure 2D). The extent and duration of the GluR1 mRNA and protein suppression largely correlated with the GluR1 ASO concentration kinetics (Figure 2, C and D). The protein expression reductions were delayed with respect to the reduction of the mRNA expression. ASOs lead to the direct degradation of the RNA template, so the reduction in protein expression will be observed only after the already translated proteins are degraded via natural processes. This slight delay in protein level suppression is likely due to the half-life of the protein. Conversely, as mRNA levels return to normal, protein levels follow without delay, as expected (Figure 2D).
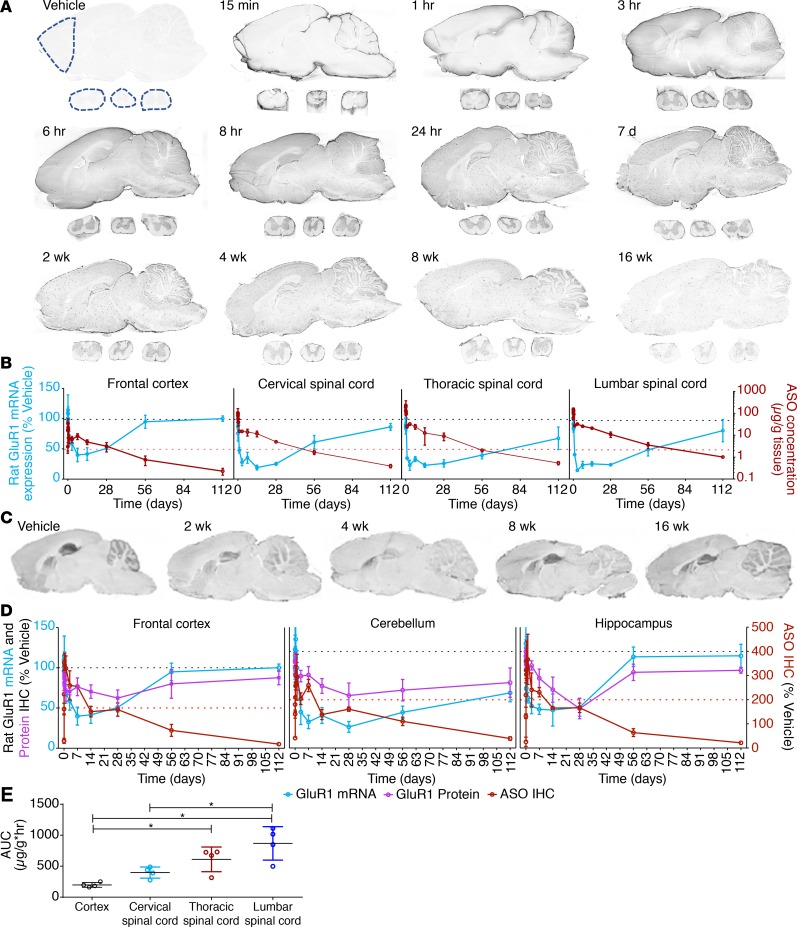
Figure 2. Ex vivo PK and PD effects of IT-dosed ASOs on brain neurotransmitter receptor mRNA and protein expression
- Subcellular kinetics of CNS permeation patterns of ASOs (Fig.3 and Fig.4).
At the earliest time point assessed, 30 minutes after injection, high densities of ASO staining were already seen along axonal bundles in the spinal cord white matter leading to the central gray matter. In adjacent sections, these ASO-laden tracts overlapped with glial fibrillary acidic protein (GFAP), a marker of astrocytic intracellular intermediate filaments. Strong intracellular staining of several spinal cord motor neurons could also be seen at this early time point. In the cerebral cortex (Figure 3), early (30 minutes after dose) ASO association with the pia was also accompanied by diffuse staining of tissue below the adjacent glia limitans, an area rich in GFAP-positive astrocytes. In contrast with the lumbar spinal cord, only sparse intracellular staining in the neurons was observed in the cerebral cortex at 30 minutes. A similar pattern was also seen in the cerebellar cortex, where diffuse extracellular ASO staining was seen in molecular and granule cell layers 30 minutes after dosing.
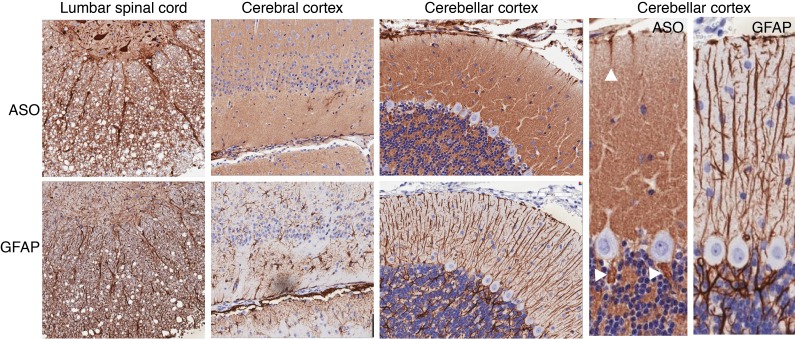
Figure 3. ASO colocalization with axonal and glial structures.
With longer postinjection intervals, a progressive translocation of ASO signal towards a strong intracellular staining pattern was observed (Figure 4). Uptake into cell bodies located in both the white and gray matter was most rapidly observed in the spinal cord, the neuraxial region most proximal to the injection site. In the brain, ASO signal permeated tissue in a centripetal manner along with a caudal to rostral progression. Although the early diffuse staining pattern appeared to be extracellular, the possibility of this ASO signal being located within astrocytic cells was suggested by the progressive staining pattern observed in the cerebellar cortex. Here, the early pattern of the diffuse staining in the molecular and granule cell layers shifted over time to a pattern marked by intracellular accumulation in neurons in all 3 layers (Figure 4B). Prominent intracellular signal appeared in Purkinje cells between 8 and 24 hours and remained for at least 7 days (Figure 4C).
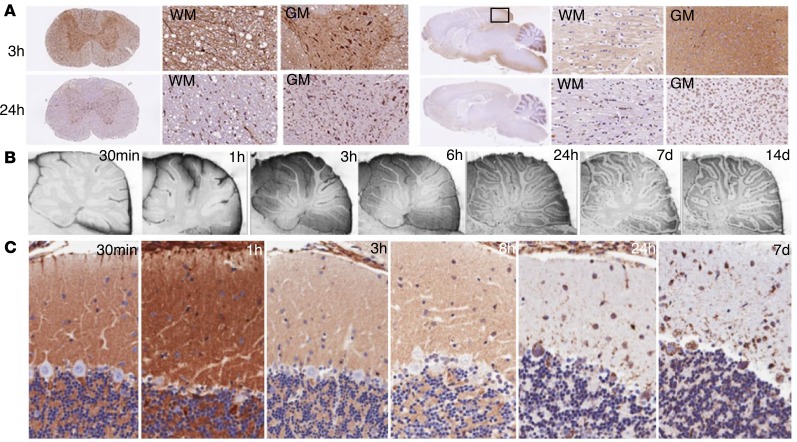
Figure 4. Cellular uptake patterns of ASOs.
- CFT map of IT ASO brain penetration (Fig.5 and Fig.6).
To more directly track the regionally heterogeneous brain entry patterns of ASOs in 2 and 3 dimensions, we directly labeled an ASO with the fluorescent tag Cy7 and tracked tissue penetration following IT dosing using fluorescence microscopy and a block-face CFT procedure. Some brain sections were also collected on glass slides for fluorescence microscopic analysis and additional IHC. Following sectioning and photography of the entire brains, the photographic data were digitally processed to create a 3D space, which allowed viewing of the data in any spatial plane of section desired. As shown in Figure 5A, in which the white light and fluorescence images are overlaid, the Gabra1-targeting ASOs entered centripetally from the CSF first into the brain parenchyma adjacent to the subarachnoid space. As with the GluR1 ASO, the Gabra1-targeting Cy7-ASO rapidly associated with the meninges and surface vessels, penetrated along vessel walls, and eventually accumulated in brain cells by 8 hours after dose, with the strongest intracellular ASO signal in what appeared to be predominantly neurons (Figure 5, A–C).
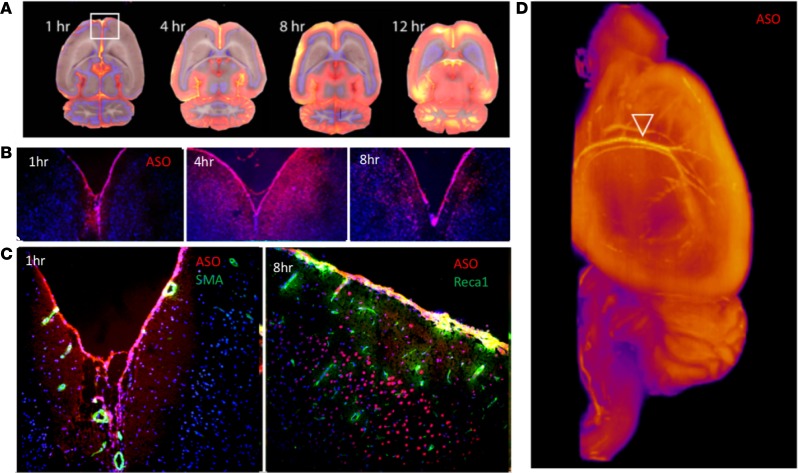
Figure 5. Cryfluorescence tomography (CFT) of ASO permeation into brain tissue.
Further visible on the 2D maps is the centripetal Cy7-ASO brain penetration apparent in sagittal, coronal, and horizontal virtual sections (Figure 6). Deeper CNS structures furthest from the subarachnoid space, such as the parts of the thalamus, brainstem, and striatum, were slower to accumulate ASO over the examined postinjection times (Figure 6). The 3D CFT maps of the fluorescence data show early association of Cy7-ASOs with major cerebral arteries and their branches (Figure 6). Cy7-ASOs prominently labeled large arteries traversing the surface of the brain as well as those in the circle of Willis and meninges (Figure 6). Between 2 and 8 hours after dosing, Cy7-ASO signal penetrated into the brain surface and a progressive loss of signal from the surface arteries occurred as the ASOs moved into the deeper tissue.
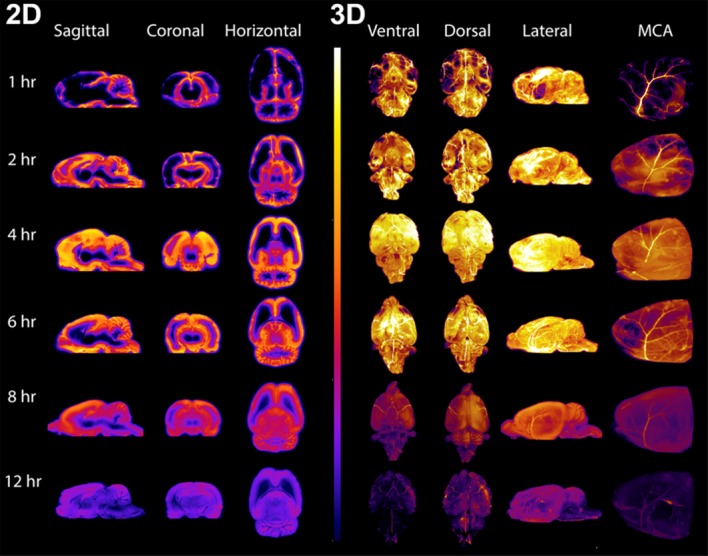
Figure 6. 2D and 3D CFT display of IT-dosed Gabra1 Cy7-ASO brain penetration over time.
- The distribution of ASOs within the perivascular compartment in the brain (Fig.7 and Fig.8).
A closer evaluation of the immunohistochemical data also revealed the presence of larger punctate ASO signals appearing throughout the brain, which increased over 24 hours and remained prominent out to 16 weeks (Figure 2, A and B, and Figure 7A). The large puncta of ASO signal matched the pattern of brain blood vessels, as confirmed by the immunohistochemical colocalization of the endothelium-specific marker Reca1 (Figure 7B) as well as αSMA and the vascular basement membrane components laminin α2 and perlecan (Figure 7, C and D). By contrast, the more diffuse immunofluorescence signal of smaller puncta was consistent with cell bodies and nuclei of brain cells (Figure 7, B, E, and F).
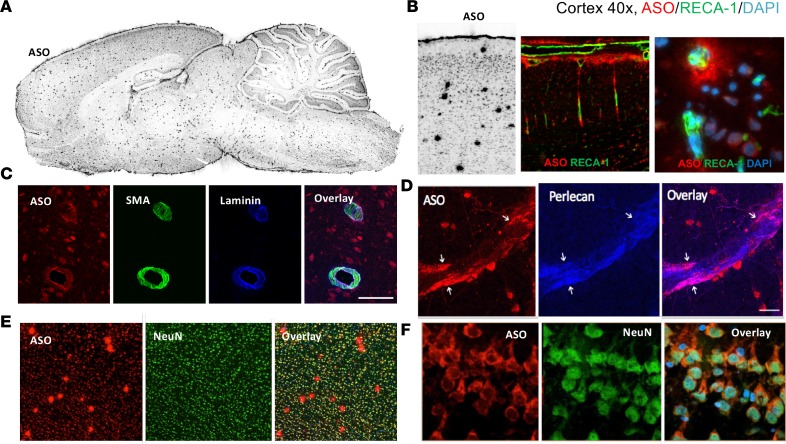
Figure 7. Perivascular and neuronal association of ASO 24 hours after dosing.
To explore the relative ASO PK in the perivascular and neuronal compartments we administered increasing IT doses (10 μg to 700 μg) of the Gabra1 ASO and euthanized animals at 14 days after dosing. Serial adjacent brain tissue sections were subsequently double stained for ASO immunoreactivity (Figure 8A) and either the neuronal marker NeuN or the vascular endothelial cell marker RecA1. To track the ASO signal intensity in the respective compartments as a function of dose, marker-specific masks were digitally overlaid onto the ASO immunostaining images (Figure 8B). Digital overlay analysis of ASO staining with the neuronal (NeuN) and vascular (Reca1) staining pattern (Figure 8B) confirmed that ASO signal intensity in these compartments behaves differently as a function of dose (Figure 8C). The pial and perivascular compartments showed near maximal signal at the lowest tested ASO dose of 10 μg, while the neuronal staining pattern required a 100-fold higher dose to reach similar intensity in the cortex (Figure 8C).
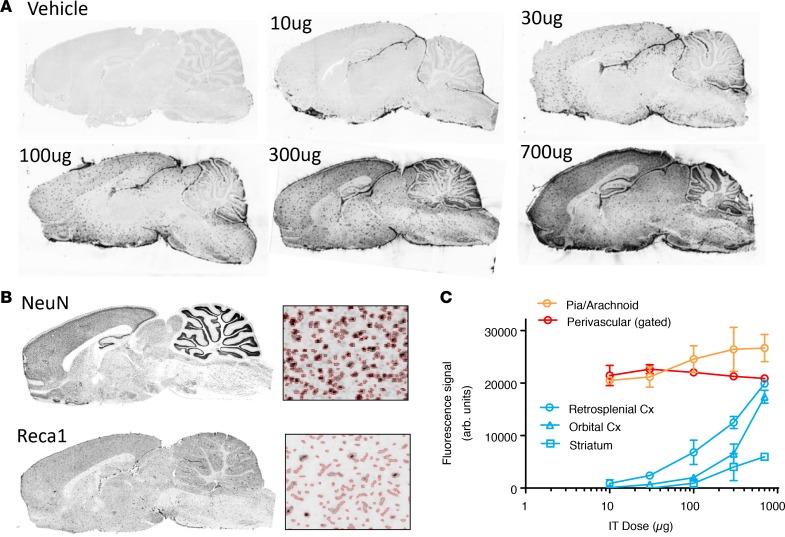
Figure 8. IT dose response of ASO interaction with vascular and neuronal elements.
- Live imaging of the PD effect of the Gabra1 ASO (Fig.9 and Fig.10).
Figure 9 shows the static and temporal effects of the Malat1 control versus Gabra1-targeted ASOs on brain 18F-flumazenil imaging of the GABAA receptor. As shown for individual brain examples, animals from both groups had a similar baseline level of brain 18F-flumazenil uptake. However, compared with baseline, IT treatment with Gabra1-targeting ASOs markedly reduced brain 18F-flumazenil uptake over time, while treatment with the Malat1 control ASO did not (Figure 9A). The time-course analysis of regional brain 18F-flumazenil uptake in all ASO-treated animals showed a progressive decline in cerebral cortical 18F-flumazenil signal in the Gabra1 ASO–treated animals, but not the Malat1 control ASO–treated animals (Figure 9B). This effect was also seen in the thalamus but was less pronounced and took longer to develop in the striatum. When the AUC values for 18F-flumazenil tissue concentration versus time were calculated, statistically significant differences between Gabra1 ASO and Malat1 control ASO treatment groups were observed at weeks 2, 3, and 4 in the cortex and thalamus and at weeks 3 and 4 in the striatum (Figure 9C).
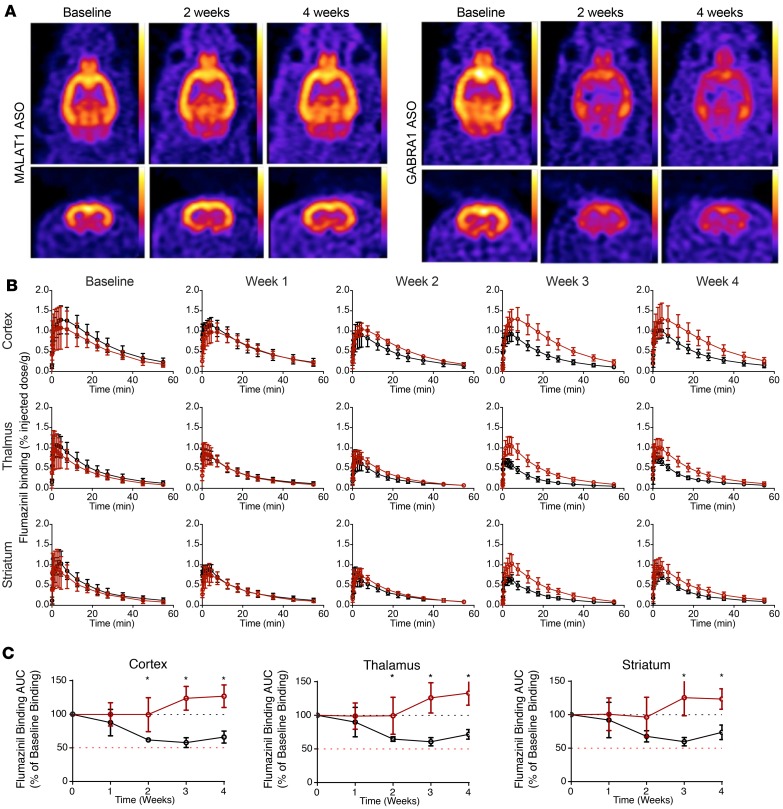
Figure 9. Live pharmacodynamic PET imaging of Gabra1 ASO–mediated receptor knockdown.
Voxel-level maps of 18F-flumazenil AUC were created for each animal by calculating the AUC at each voxel in the brain. 3D group-level brain 18F-flumazenil AUC maps for the Malat1 ASO– versus Gabra1 ASO–treated groups were created by averaging the individual AUC maps of all animals in each group after co-registration. There was a marked overall reduction in brain 18F-flumazenil AUC values in the Gabra1 ASO–treated rats compared with the Malat1 control ASO–treated rats (Figure 10A). By subtracting the 18F-flumazenil AUC maps between the 2 groups from scans at 4 weeks after IT ASO injection, we generated a difference map displaying the brain regions most impacted by the ASO treatment (Figure 10B). This relative PD anatomical map of Gabra1 ASO action on brain 18F-flumazenil uptake matched the pattern of Cy7-labeled Gabra1 ASO distribution observed in individual animal samples at earlier time points in both 3D and 2D reconstructions of the CFT experiment with Cy7-labeled Gabra1 ASO (Figure 10C). These data suggest a tight temporal and regional anatomical relationship between the PK and PD effects of IT-delivered ASOs in the brain.
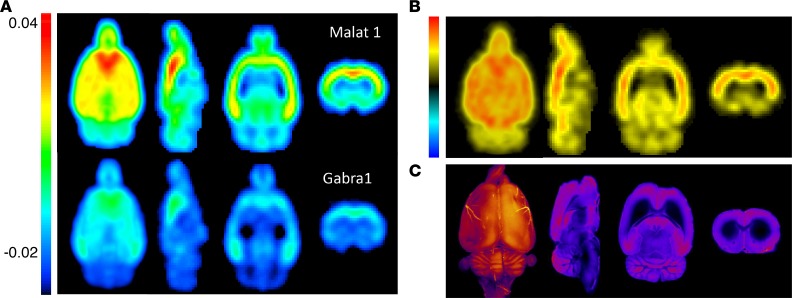
Figure 10. Nuclear and fluorescence imaging maps of ASO PK and PD.
Conclusion
Taken together, these data support a model in which following lumbar cistern IT delivery, ASOs distribute rapidly throughout the CSF along the neuraxis and associate with the meningeal layer covering the CNS and penetrating cerebral arteries. ASO movement into and within the parenchyma likely involves perivascular pathways, white-matter tracts, and possibly direct migration through the glial limitans via gap junctions or transcellular exchange mechanisms between the pial cells and adjacent astrocytes. Once distributed to the various regions of the CNS, ASOs are taken up into cells where their action is exerted on the target RNA. Our results also indicate that in rats movement across the nasal turbinates, through meningeal lymphatics and into peripheral lymph nodes, and then to systemic circulation is a route of clearance of ASO from the CNS compartment.
ASOs have the potential to target underlying disease pathophysiology and deliver dramatic benefits to patients. Together, our multimodal imaging approaches have helped overcome the challenges of studying the PK and PD of these molecules in the IT space and have helped provide insights into IT ASO pharmacology. The unique pharmacological properties of ASOs make them promising therapeutics, and the detailed understanding of their IT pharmacology provided here will help to deliver on this promise.
Reference
Mazur, C., et al., Brain pharmacology of intrathecal antisense oligonucleotides revealed through multimodal imaging. JCI Insight, 2019. 4(20).